Description
Amplitude Scan (A-Scan)
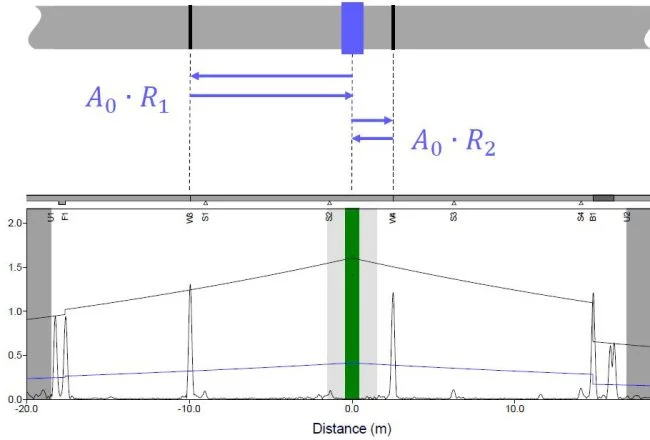
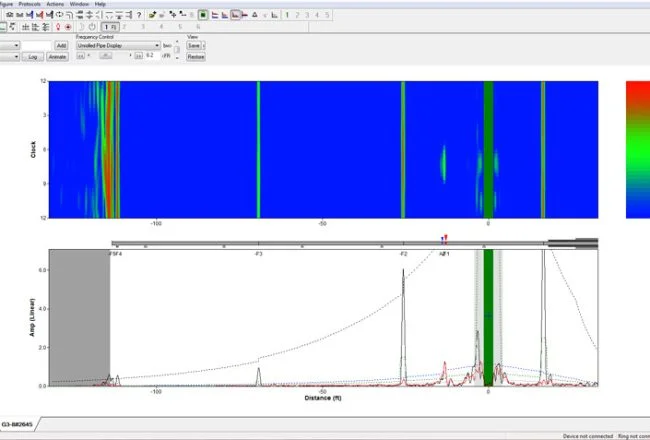
The main features of the A-Scan are the Distance‐Amplitude Correction (DAC) curves, symmetric (black) signals & the non-symmetric (red) signals.
These features provide information about the type of features or defects, including their location along the inspected pipe length and an estimated cross-sectional change.
Report Generator
Once the data has been analysed by a trained inspector, the data can be automatically compiled into a single report which would include the A-Scans, reflection annotations and operator notes.
The report can be output to either PDF, Word Document or Excel Spreadsheet format for flexibility.
Enhanced Focusing Capability (EFC)
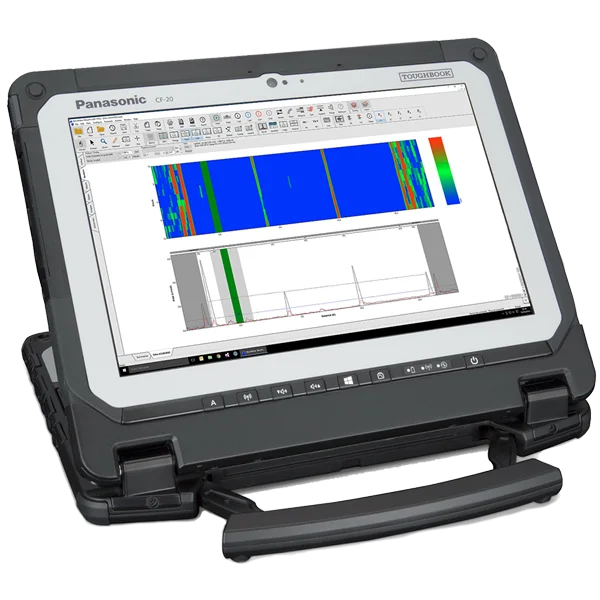
Enhanced Focusing Capability (EFC) Processing Licence activates full matrix data capture (FMC) and the advanced post-processing data analysis. This capability focuses the guided wave energy allowing the software to generate an unrolled image of the pipe (C-Scan). Defects and pipe features can be more easily located, including their orientation around the pipe circumference. The example in the figure above demonstrates how a defect can be easily visualised and located on the pipe using the C-Scan.
Absolute Calibration
The absolute calibration licence activates the processing functionality required for automatic amplitude calibration and reverberation simulation. It calculates the DAC amplitude levels, resulting in accurate assessment of indications. The software checks whether absolute calibration is valid for a given guided wave result. The simulated reverberation feature will also assist inspectors with the identification of false echoes through the use of advanced signal processing.
